General
Phase diagrams are representations, in the isobar plane \((T, X)\) (temperature - composition), of the physical-chemical constitution of an alloy in a state of thermodynamic equilibrium. They indicate, as a function of temperature, the nature, chemical composition and mass fractions of the phases present for an alloy of a determined concentration. Phase diagrams describe the \(\ce{liquid <-> solid}\) and \(\ce{solid <-> solid}\) equilibria that govern the solidification of alloys.
As an example, the figure below shows what a phase diagram looks like: it is in fact a fictional diagram of an \(\ce{AB}\) binary alloy revealing single-phase, two-phase and three-phase regions in accordance with Gibbs' rule (\(v = 3 - \phi\)). In the case shown here, element \(\ce{A}\) presents two crystalline forms marked \(A_{\alpha} \)and \(A_{\alpha’}\), and the same for element \(\ce{B}\) : \(B_{\beta} \)and \(B_{\beta’}\).
The phase diagram presents six different phases:
the liquid phase (present above the liquidus, which defines the limit above which the alloy is only liquid)
\(\alpha\) a primary solid solution of B in \(A_{\alpha}\)
\(\alpha’\) a primary solid solution of B in \(A_{\alpha’}\)
\(\beta\) a primary solid solution of A in \(B_{\beta}\)
\(\beta’\) a primary solid solution of A in \(B_{\beta’}\)
\(\gamma\) an intermediate solid solution
\(\ce{A_mB_n}\) a stoichiometric compound
Note also that the solidus defines the limit below which there is no more liquid.

The \(\alpha\), \(\alpha’\), \(\beta\) and \(\beta’\) regions, to which must be added the vertical of the stoichiometric compound, are one-phase region. All the other regions are two-phase regions, except the horizontals, for which three phases are in equilibrium.
Within the boundaries of the one-phase regions (\(v = 2\)), temperature and composition may vary independently without changing the nature of the phase. In two-phase regions (\(v = 1\)), the compositions of the two phases in equilibrium are perfectly determined at a given temperature. They can be determined by two simple rules.
Tie-line rule
At temperature \(T\), the alloy \(\ce{AB}\) of composition \(X\) (mass% of \(B\)) is composed of two phases \(\phi_1\) and \(\phi_2\) characterized respectively by contents \(x \left(\phi_1 \right)\) (mass%) of \(\ce{B}\) and \(\left(100 - x \left(\phi_1 \right) \right)\) (mass%) of \(\ce{A}\) and \(x \left(\phi_2 \right)\) (mass%) of B and \(\left(100 - x \left(\phi_2 \right) \right)\) (mass%) of \(\ce{A}\). The compositions correspond to the abscissa of points \(M\) and \(P\) intersections of the horizontal at temperature \(T\) with the two boundaries of the two-phase region. The tie-line rule thus describes the chemical composition of the phases in equilibrium at any temperature where the two-phase region exists.
Lever rule
At temperature \(T\), the specific alloy of composition \(X\) in element \(\ce{B}\) is characterized by a particular mass fraction of the phases \(\phi_1\) and \(\phi_2\). If \(m_1\), \(m_2\) and m are respectively the masses of phases \(\phi_1\) , \(\phi_2\) and of the alloy, this gives:
\(m_1 + m_2 = m\)
\(m_1.X\left(\Phi_1\right) + m_2.X\left(\Phi_2\right) = m.X\)
\(\frac{m_1}{m} = \frac{\left(X_2 - X \right)}{\left(X_2 - X_1\right)} = \frac{\bar{MN}}{\bar{PM}}\)
\(\frac{m_2}{m} = \frac{\bar{NP}}{\bar{PM}}\)
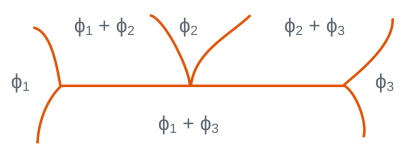
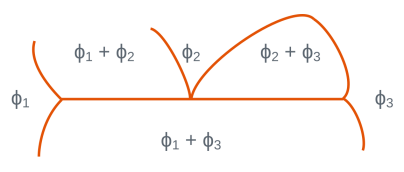
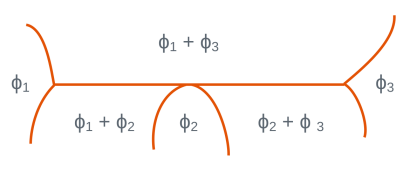
In three-phase regions for which the variance is zero, three phases with fixed compositions are in equilibrium at a given temperature. The temperature cannot be changed without one of the phases disappearing. There is isothermal equilibrium between three phases according to reactions of type: \(\phi_2 <=> \phi_1 + \phi_3\). The table below shows the main isothermal reactions and details the configurations of the different phases and the type of reaction or transformation.
Among the reactions mentioned, eutectic and eutectoid transformations are of particular importance because they lead to microstructures with a characteristic morphology (eutectic and eutectoid constituents). These reactions are presented in numerous binary diagrams, for example
\(\ce{Fe-C}\), \(\ce{Al-Si}\), \(\ce{Cu-Zn}\), \(\ce{Pb-Sn}\).


Local configuration of the diagram | \(\phi_1\) | \(\phi_2\) | \(\phi_3\) | Reaction or transformation |
|---|---|---|---|---|
Eutectic type | solid solid solid | liquid solid solid | solid solid liquid | eutectic eutectoid |
Monotectic type | solid solid | liquid solid | liquid solid | monotectic monotectoid |
Peritectic type | solid solid | solid solid | liquid solid | peritectic peritectoid |